Quickstart#
This tutorial presents you the fundamental concepts of healpix-geo through practical examples.
First example : Coordinates conversion#
The most common task is to convert geographic coordinates into HEALPix cell identifiers:
import numpy as np
from healpix_geo.nested import lonlat_to_healpix, healpix_to_lonlat

# Define some points of interest (longitude, latitude in degrees)
paris = (2.3522, 48.8566)
tokyo = (139.6917, 35.6895)
new_york = (-74.0060, 40.7128)

lon = np.array([paris[0], tokyo[0], new_york[0]])
lat = np.array([paris[1], tokyo[1], new_york[1]])

# Convert in HEALPix cells level 8
depth = 8
ipix = lonlat_to_healpix(lon, lat, depth, ellipsoid="WGS84")

print(f"HEALPix cells (depth={depth}):")
print(f"  Paris: {ipix[0]}")
print(f"  Tokyo: {ipix[1]}")
print(f"  New York: {ipix[2]}")
HEALPix cells (depth=8):
  Paris: 44744
  Tokyo: 81241
  New York: 238830
Note
Cell indices are unique integers that identify each cell. Each city is in a different cell at level 8.
Understand depth parameter#
The depth parameter (or level) controls the tiling resolution :
depth=0: 12 cells around the world (~6 520 km per cell)depth=8: 786 432 cells (~25 km per cell)depth=12: 201 326 592 cells (~1.6 km per cell)
See also
See Cell statistics for a complete table of levels with their resolutions.
Example: Same point at different resolutions#
# Same point at different resolutions
lon, lat = np.array([2.3522]), np.array([48.8566])  # Paris

for depth in [0, 4, 8, 12]:
    ipix = lonlat_to_healpix(lon, lat, depth, ellipsoid="WGS84")
    print(f"Depth {depth:2d}: cell {ipix[0]:10d}")
Depth  0: cell          0
Depth  4: cell        174
Depth  8: cell      44744
Depth 12: cell   11454554
Tip
General rule: Increasing the depth by 1 multiplies the number of cells by 4 and divides the cell size by 2.
Reverse conversion: cell → coordinates#
Recover the coordinates of the center of a cell:
# Obtain coordinates of the cell center
ipix = np.array([349440])  # Paris
depth = 8

lon_center, lat_center = healpix_to_lonlat(ipix, depth, ellipsoid="WGS84")
print(f"Cell center {ipix[0]}:")
print(f"  Longitude: {lon_center[0]:.4f}°")
print(f"  Latitude:  {lat_center[0]:.4f}°")
Cell center 349440:
  Longitude: 132.1875°
  Latitude:  -2.2487°
Note
The center coordinates may be slightly different from the original coordinates, because we have “rounded” to the nearest cell.
Research of neighbour#
HEALPix makes it easy to find neighboring cells:
from healpix_geo.nested import kth_neighbourhood

ipix = np.array([100])
depth = 5
k = 1  # direct neighbour (distance 1)

neighbours = kth_neighbourhood(ipix, depth, k)
print(f"Direct neighbourhoods of the cell {ipix[0]}:")
print(neighbours)
Direct neighbourhoods of the cell 100:
[[100  75  97  99 102 103 101  79  78]]
See also
For more details on hierarchy and neighbourhood, see Hierarchical Indexing.
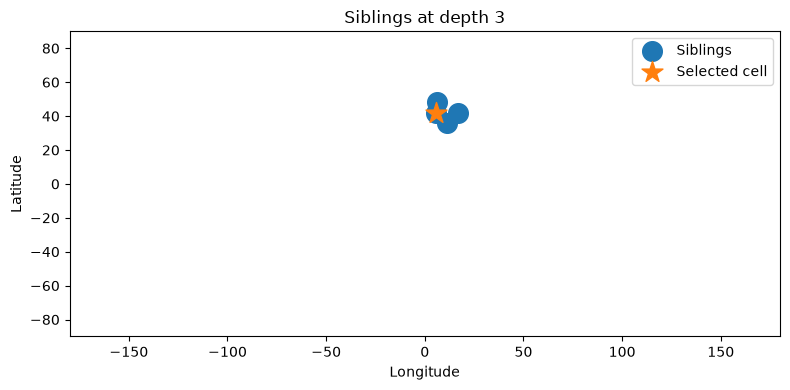
Sibling#
import numpy as np
from healpix_geo.nested import siblings, healpix_to_lonlat

depth = 3

# Choose one cell
ipix = np.array([42], dtype=np.uint64)

# Get siblings (same parent)
sib = siblings(ipix, depth)

print(f"Cell: {ipix[0]} at depth {depth}")
print(f"Siblings: {sib}")
Cell: 42 at depth 3
Siblings: [[40 41 42 43]]
Visualisation :
Next Steps#
Now you know basics, you can explore :